Product
Company licence, no individual user licence.


Company licence, no individual user licence.
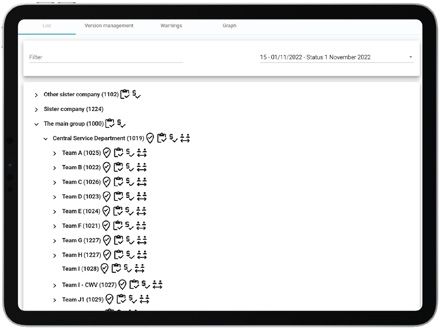
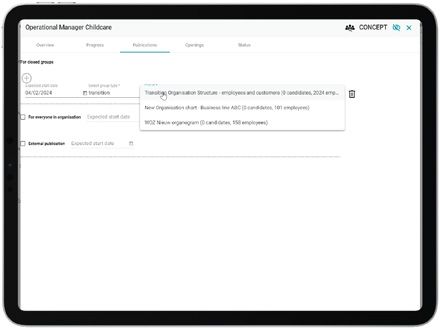
Discover and monitor the organization chart of your organization . Define and communicate the transitions on the organization chart. Time travel to the future or past by defining versions of the organization chart.
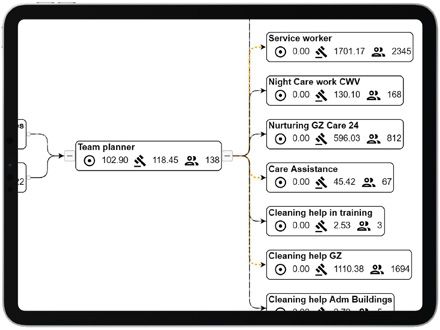
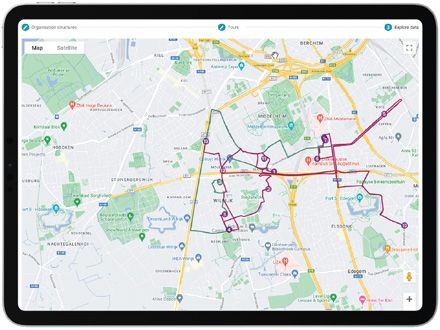
Discover and define the organisation structure with all the related information (products, financial budget codes, contact information, working area, responsibles, …)
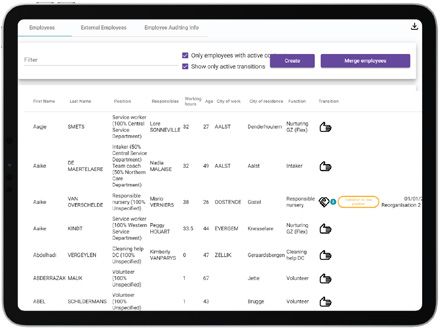
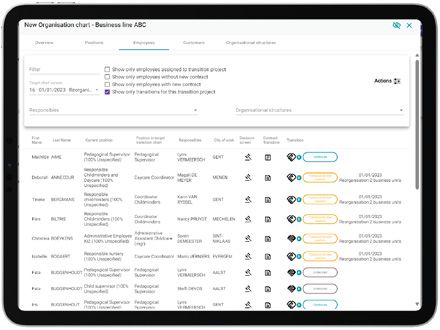
Full overview of all the employee’s or contractors’ information including transition and survey information. Unified view over multiple HR sources.
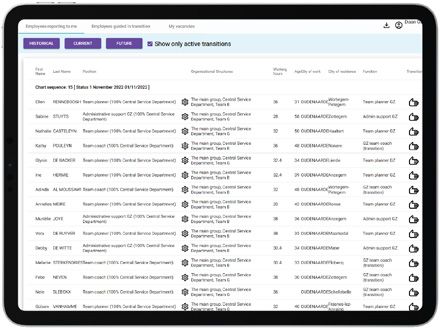
Dashboard that gives you direct access to the information of the employees that are reporting to you and/or you guide in in a transition project.

Dashboard that gives you direct access to the information of the employees that are reporting to you and/or you guide in in a transition project.
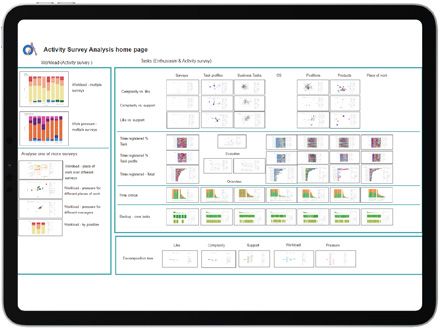
Define surveys and access the results and perform employee interviews based on surveys results.
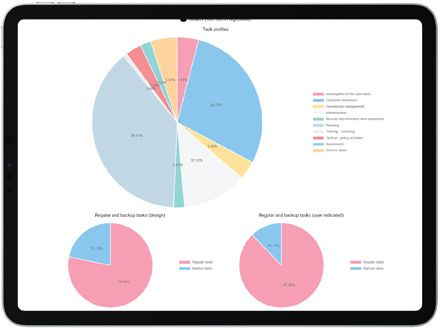
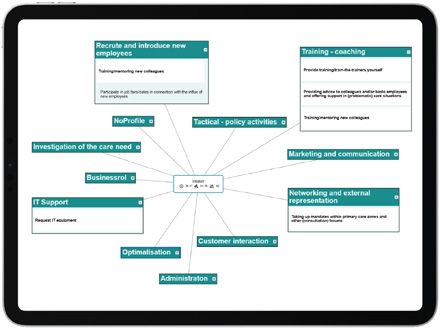
Get an overview of who performs / is supposed to perform which tasks
Transition projects gives the experts an overview of the transition projects. Multiple projects can be configures and run in parallel in the organisation.
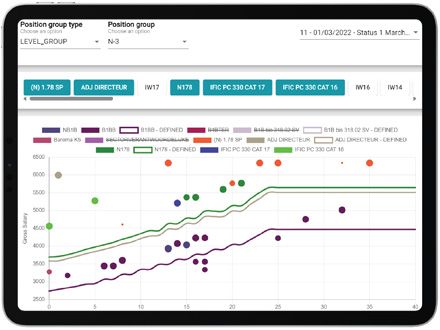
Compare the renumeration of multiple functions in the organisations (several groupings are possible)
Manage vacancies during the transition project. Vacancies become important when it become ifficult to fill the organisation structure because there are too many or not enough candidates for a position.
Advanced customer allocation functionality
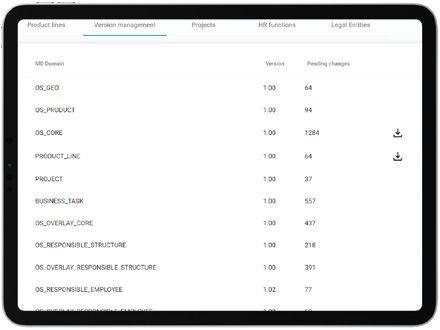
Manage the organisation master data (including version control and auditing) . Master data support with full versioning, auditing and release management.
Prove access to your data from PowerBI. Number of default power BI reports that can be used to analyse your information. Reports can be tailored to answer specific information requests.
Time required is one hour via web call to explore the platform.